
You must log in or register to comment.
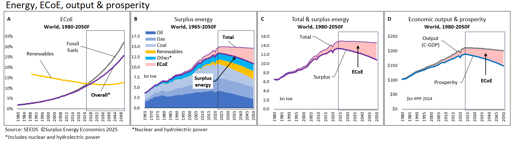
The graphs in figure 1 are a little bit suspect
Why?
They show continuous upwards growth interrupted by little divots of downturns, and then they extrapolate a downturn I can’t even really detect that we’re allegedly in right now into all of a sudden steadily and uniformly downward from this day forward.
I mean, maybe, but it kind of seems like they’re just drawing the picture they want to draw and not the one that’s indicated by the data.
Examining other data on growth and energy generation reveals steady growth. So I doubt the message of the article a little.